
Trustworthy measurements
An observation becomes useful release evidence only when its meaning, time window, and candidate are known. A zero error count can mean a healthy application, absent traffic, a missing series deliberately replaced with zero, or a chart looking at the wrong window. Those possibilities require different decisions.
Resilience Gate uses explicit query and evidence contracts to reduce ambiguity. The contracts are stronger than a dashboard glance and narrower than a general guarantee of continuous service.
Start with the question a signal answers
Section titled “Start with the question a signal answers”During a PostgreSQL experiment, an application restart count asks whether the process was destabilized. PostgreSQL readiness asks whether the dependency was observed unavailable and later available. A request counter asks whether non-probe HTTP traffic occurred. A /shorten 500 count asks whether that specific unhandled-error symptom occurred. None alone proves the whole hypothesis.
Redis needs another signal: redirect latency under fallback. Its cache-miss counter counts ordinary cache misses as well as unavailable-cache fallback. A rising counter therefore supports evidence that the database path was exercised; it is not independent proof that Redis failed. The target readiness series and the recorded fault application event provide that separate evidence. The metric’s actual description appears in application source.
For the signer, quiet application 5xx counters require particular care. The load client’s payment flow obtains a fresh signature before calling /shorten. A failed signing request returns early. The application can therefore see fewer paid requests while the signer is unavailable. A live k6 Job plus quiet application errors does not establish uninterrupted paid URL creation.
The actual fault anchors the window
Section titled “The actual fault anchors the window”The orchestrator captures the earliest Succeeded / Apply event on the exact typed PodChaos child of each workflow node. A node’s creation or startTime describes scheduling, not proof that a target changed. It collects these events while the workflow runs because Chaos Mesh may remove child resources when the workflow becomes terminal.
For every current experiment, the scorer requests range evidence from 20 seconds before injection to 120 seconds after injection. That consists of 60 seconds of fault plus 60 seconds of scored settling time. Counter increases use a 120-second lookback evaluated at the end, excluding the 20-second lead. Redirect p95 uses one-minute histogram rates at each range step; the scorer takes the maximum returned p95.
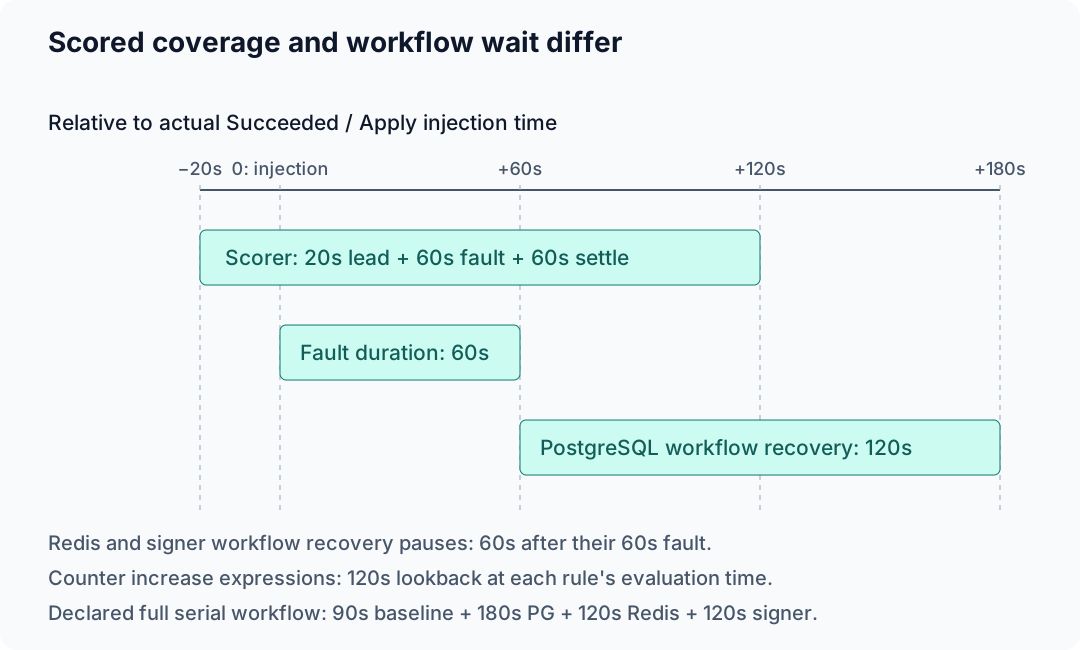
Enlarge diagram: Fault and measurement windows · Version-controlled diagram source

Workflow pauses and query windows are related but distinct. PostgreSQL receives a 120-second workflow recovery pause while its scorer uses 60 seconds of settling time.
The workflow waits 120 seconds after the PostgreSQL fault before starting Redis. That does not enlarge the PostgreSQL scorer window. Reading an entire dashboard selection as the scored window can accidentally overstate the recovery deadline actually checked.
Missing evidence is not one universal case
Section titled “Missing evidence is not one universal case”The scorer rejects an empty Prometheus result, malformed response, non-finite number, wrong result kind, stale sample, or insufficient range coverage. Range data must include at least three samples per returned series, start and end within 60 seconds of the requested boundaries, and contain no adjacent gap greater than 75 seconds. Instant queries must return exactly one sample within 60 seconds of evaluation time. The default range step and request timeout are each 15 seconds.
These rules validate the data returned by the expression. Several expressions explicitly use or vector(0): application restarts, PostgreSQL /shorten 500 responses, signer /shorten 5xx, and payment replays. If the left side is absent, Prometheus can return the synthetic zero vector. The parser sees that as present finite evidence. It cannot recover the fact that the left side was absent.
That fallback is an implemented policy for particular quiet counters, not a statement that every missing metric fails. Request volume, Redis cache misses, redirect latency, and target readiness do not use this fallback. No-data tests establish rejection of empty and bad returned evidence; they should not be read as proof that query-level zero fallbacks were removed.
Aggregation changes the claim
Section titled “Aggregation changes the claim”A readiness range has two checks: its minimum must equal zero, then its last sample must equal one. The first demonstrates an observed unavailable state somewhere in the window. The second demonstrates availability at the end of the returned range. They do not prove that the dependency stayed healthy thereafter or bound every request’s experience during recovery.
PostgreSQL and Redis request totals must be strictly greater than 50. Redis p95 must be strictly below 1.2 seconds. Restart, error, and replay increases must be strictly below 0.5; increases can be fractional because the Prometheus calculation extrapolates counters. A value equal to a strict bound fails. The metrics reference lists every expression, aggregation, unit, and operator.
Pair the observation with provenance
Section titled “Pair the observation with provenance”A scorecard carries the rendered expressions, sample count, observed values or evidence errors, bounded window, source/Freight revision, application digest, and run ID. It keeps failed checks rather than hiding them behind one boolean. The scorecard schema makes that portable record inspectable.
A screenshot supplies visual context. A selected scorecard establishes a measurement result. The enclosing Job and AnalysisRun establish different outcomes. Review all relevant layers before calling a candidate verified. The score-to-promotion workflow explains why green at one layer remains insufficient.
Maintained by Satyam Agnihotri · DevOps & Cloud Engineer